2.5. Red Hat Linux-Specific Information
Red Hat Linux comes with a variety of resource monitoring tools. While there are more than those listed here, these tools are representative in terms of functionality. The tools are:
free
top (and GNOME System Monitor, a more graphically oriented version of top)
vmstat
The Sysstat suite of resource monitoring tools
Let us look at each one in more detail.
2.5.1. free
The free command displays system memory utilization. Here is an example of its output:
total used free shared buffers cached Mem: 255508 240268 15240 0 7592 86188 -/+ buffers/cache: 146488 109020 Swap: 530136 26268 503868 |
The Mem: row displays physical memory utilization, while the Swap: row displays the utilization of the system swap space, and the -/+ buffers/cache: row displays the amount of physical memory currently devoted to system buffers.
Since free by default only displays memory utilization information once, it is only useful for very short-term monitoring, or quickly determining if a memory-related problem is currently in progress. Although free has the ability to repetitively display memory utilization figures via its -s option, the output scrolls, making it difficult to easily see changes in memory utilization.
 | Tip | ||
|---|---|---|---|
A better solution than using free -s would be to run free using the watch command. For example, to display memory utilization every two seconds (the default display interval), use this command:
The watch command issues the free command every two seconds, after first clearing the screen. This makes it much easier to see how memory utilization changes over time, as it is not necessary to scan continually scrolling output. You can control the delay between updates by using the -n option, and can cause any changes between updates to be highlighted by using the -d option, as in the following command:
For more information, refer to the watch man page. The watch command runs until interrupted
with |
2.5.2. top
While free displays only memory-related information, the top command does a little bit of everything. CPU utilization, process statistics, memory utilization — top does it all. In addition, unlike the free command, top's default behavior is to run continuously; there is no need to use the watch command. Here is a sample display:
11:13am  up 1 day, 31 min,  5 users,  load average: 0.00, 0.05, 0.07
89 processes: 85 sleeping, 3 running, 1 zombie, 0 stopped
CPU states:  0.5% user,  0.7% system,  0.0% nice, 98.6% idle
Mem:  255508K av, 241204K used,  14304K free,    0K shrd,   16604K buff
Swap: 530136K av,  56964K used, 473172K free                64724K cached

  PID USER   PRI  NI  SIZE  RSS SHARE STAT %CPU %MEM   TIME COMMAND
 8532 ed      16   0  1156 1156   912 R     0.5  0.4   0:11 top
 1520 ed      15   0  4084 3524  2752 S     0.3  1.3   0:00 gnome-terminal
 1481 ed      15   0  3716 3280  2736 R     0.1  1.2   0:01 gnome-terminal
 1560 ed      15   0 11216  10M  4256 S     0.1  4.2   0:18 emacs
    1 root    15   0   472  432   416 S     0.0  0.1   0:04 init
    2 root    15   0     0    0     0 SW    0.0  0.0   0:00 keventd
    3 root    15   0     0    0     0 SW    0.0  0.0   0:00 kapmd
    4 root    34  19     0    0     0 SWN   0.0  0.0   0:00 ksoftirqd_CPU0
    5 root    15   0     0    0     0 SW    0.0  0.0   0:00 kswapd
    6 root    25   0     0    0     0 SW    0.0  0.0   0:00 bdflush
    7 root    15   0     0    0     0 SW    0.0  0.0   0:00 kupdated
    8 root    25   0     0    0     0 SW    0.0  0.0   0:00 mdrecoveryd
   12 root    15   0     0    0     0 SW    0.0  0.0   0:00 kjournald
   91 root    16   0     0    0     0 SW    0.0  0.0   0:00 khubd
  185 root    15   0     0    0     0 SW    0.0  0.0   0:00 kjournald
  186 root    15   0     0    0     0 SW    0.0  0.0   0:00 kjournald
576 root 15 0 712 632 612 S 0.0 0.2 0:00 dhcpcd |
The display is divided into two sections. The top section contains information related to overall system status — uptime, load average, process counts, CPU status, and utilization statistics for both memory and swap space. The lower section displays process-level statistics, the exact nature of which can be controlled while top is running.
 | Warning |
|---|---|
Although top looks like a simple display-only
program, this is not the case. top uses single
character commands to perform various operations; if you are logged
in as root, it is possible to change the priority and even kill any
process on your system. Therefore, until you have reviewed
top's help screen (type |
2.5.2.1. The GNOME System Monitor — A Graphical top
If you are more comfortable with graphical user interfaces, the GNOME System Monitor may be more to your liking. Like top, the GNOME System Monitor displays information related to overall system status, process counts, memory and swap utilization, and process-level statistics.
However, the GNOME System Monitor goes a step further by also including graphical representations of CPU, memory, and swap utilization, along with a tabular disk space utilization listing. Here is an example of the GNOME System Monitor's Process Listing display:
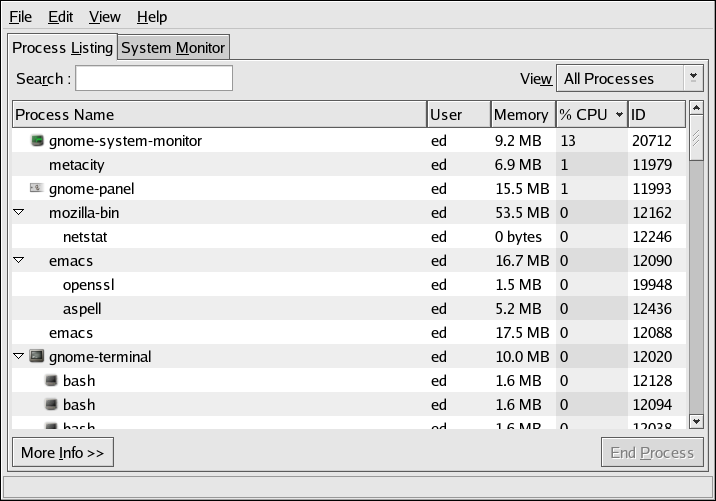
Additional information can be displayed for a specific process by first clicking on the desired process and then clicking on the More Info button.
To view the CPU, memory, and disk usage statistics, click on the System Monitor tab.
2.5.3. vmstat
For a more concise view of system performance, try vmstat. Using this resource monitor, it is possible to get an overview of process, memory, swap, I/O, system, and CPU activity in one line of numbers:
   procs                      memory    swap          io     system         cpu
 r  b  w   swpd   free   buff  cache  si  so    bi    bo   in    cs  us  sy  id
 1  0  0      0 524684 155252 338068   0   0     1     6  111   114  10   3  87
|
The process-related fields are:
r — The number of runnable processes waiting for access to the CPU
b — The number of processes in an uninterruptible sleep state
w — The number of processes swapped out, but runnable
The memory-related fields are:
swpd — The amount of virtual memory used
free — The amount of free memory
buff — The amount of memory used for buffers
cache — The amount of memory used as page cache
The swap-related fields are:
si — The amount of memory swapped in from disk
so — The amount of memory swapped out to disk
The I/O-related fields are:
bi — Blocks sent to a block device
bo— Blocks received from a block device
The system-related fields are:
in — The number of interrupts per second
cs — The number of context switches per second
The CPU-related fields are:
us — The percentage of the time the CPU ran user-level code
sy — The percentage of the time the CPU ran system-level code
id — The percentage of the time the CPU was idle
When vmstat is run without any options, only one line is displayed. This line contains averages, calculated from the time the system was last booted.
However, most system administrators do not rely on the data in this line, as the time over which it was collected varies. Instead, most administrators take advantage of vmstat's ability to repetitively display resource utilization data at set intervals. For example, the command vmstat 1 displays one new line of utilization data every second, while the command vmstat 1 10 displays one new line per second, but only for the next ten seconds.
In the hands of an experienced administrator, vmstat can be used to quickly determine resource utilization and performance issues. But to gain more insight into those issues, a different kind of tool is required — a tool capable of more in-depth data collection and analysis.
2.5.4. The Sysstat Suite of Resource Monitoring Tools
While the previous tools may be helpful for gaining more insight into system performance over very short time frames, they are of little use beyond providing a snapshot of system resource utilization. In addition, there are aspects of system performance that cannot be easily monitored using such simplistic tools.
Therefore, a more sophisticated tool is necessary. Sysstat is such a tool.
Sysstat contains the following tools related to collecting I/O and CPU statistics:
- iostat
Displays an overview of CPU utilization, along with I/O statistics for one or more disk drives.
- mpstat
Displays more in-depth CPU statistics.
Sysstat also contains tools that collect system resource utilization data and create daily reports based on that data. These tools are:
- sadc
Known as the system activity data collector, sadc collects system resource utilization information and writes it to a file.
- sar
Producing reports from the files created by sadc, sar reports can be generated interactively or written to a file for more intensive analysis.
The following sections explore each of these tools in more detail.
2.5.4.1. The iostat command
The iostat command at its most basic provides an overview of CPU and disk I/O statistics:
Linux 2.4.18-18.8.0 (pigdog.example.com)     12/11/2002

avg-cpu:  %user   %nice    %sys   %idle
           6.11    2.56    2.15   89.18

Device:            tps   Blk_read/s   Blk_wrtn/s   Blk_read   Blk_wrtn
dev3-0            1.68        15.69        22.42   31175836   44543290
|
Below the first line (which displays the system's kernel version and hostname, along with the current date), iostat displays an overview of the system's average CPU utilization since the last reboot. The CPU utilization report includes the following percentages:
Percentage of time spent in user mode (running applications, etc.)
Percentage of time spent in user mode (for processes that have altered their scheduling priority using nice(2))
Percentage of time spent in kernel mode
Percentage of time spent idle
Below the CPU utilization report is the device utilization report. This report contains one line for each active disk device on the system and includes the following information:
The device specification, displayed as dev<major-number>-sequence-number, where <major-number> is the device's major number[1], and <sequence-number> is a sequence number starting at zero.
The number of transfers (or I/O operations) per second.
The number of 512-byte blocks read per second.
The number of 512-byte blocks written per second.
The total number of 512-byte blocks read.
The total number of 512-byte block written.
This is just a sample of the information that can be obtained using iostat. For more information, see the iostat(1) man page.
2.5.4.2. The mpstat command
The mpstat command at first appears no different from the CPU utilization report produced by iostat:
Linux 2.4.18-14smp (pigdog.example.com)      12/11/2002

07:09:26 PM  CPU   %user   %nice %system   %idle    intr/s
07:09:26 PM  all    6.40    5.84    3.29   84.47    542.47
|
With the exception of an additional column showing the interrupts per second being handled by the CPU, there is no real difference. However, the situation changes if mpstat's -P ALL option is used:
Linux 2.4.18-14smp (pigdog.example.com)      12/11/2002

07:13:03 PM  CPU   %user   %nice %system   %idle    intr/s
07:13:03 PM  all    6.40    5.84    3.29   84.47    542.47
07:13:03 PM    0    6.36    5.80    3.29   84.54    542.47
07:13:03 PM    1    6.43    5.87    3.29   84.40    542.47
|
On multiprocessor systems, mpstat allows the utilization for each CPU to be viewed individually, making it possible to determine how effectively each CPU is being used.
2.5.4.3. The sadc command
As stated earlier, the sadc command collects system utilization data and writes it to a file for later analysis. By default, the data is written to files in the /var/log/sa/ directory. The files are named sa<dd>, where <dd> is the current day's two-digit date.
sadc is normally run by the sa1 script. This script is periodically invoked by cron via the file sysstat, which is located in /etc/crond.d. The sa1 script invokes sadc for a single one-second measuring interval. By default, cron runs sa1 every 10 minutes, adding the data collected during each interval to the current /var/log/sa/sa<dd> file.
2.5.4.4. The sar command
The sar command produces system utilization reports based on the data collected by sadc. As configured in Red Hat Linux, sar is automatically run to process the files automatically collected by sadc. The report files are written to /var/log/sa/ and are named sar<dd>, where <dd> is the two-digit representations of the previous day's two-digit date.
sar is normally run by the sa2 script. This script is periodically invoked by cron via the file sysstat, which is located in /etc/crond.d. By default, cron runs sa2 once a day at 23:53, allowing it to produce a report for the entire day's data.
2.5.4.4.1. Reading sar Reports
The format of a sar report produced by the default Red Hat Linux configuration consists of multiple sections, with each section containing a specific type of data, ordered by the time of day that the data was collected. Since sadc is configured to perform a one-second measurement interval every ten minutes, the default sar reports contain data in ten-minute increments, from 00:00 to 23:50[2].
Each section of the report starts with a heading that illustrates the data contained in the section. The heading is repeated at regular intervals throughout the section, making it easier to interpret the data while paging through the report. Each section ends with a line containing the average of the data reported in that section.
Here is a sample section sar report, with the data from 00:30 through 23:40 removed to save space:
00:00:01          CPU     %user     %nice   %system     %idle
00:10:00          all      6.39      1.96      0.66     90.98
00:20:01          all      1.61      3.16      1.09     94.14
…
23:50:01          all     44.07      0.02      0.77     55.14
Average:          all      5.80      4.99      2.87     86.34
|
In this section, CPU utilization information is displayed. This is very similar to the data displayed by iostat.
Other sections may have more than one line's worth of data per time, as shown by this section generated from CPU utilization data collected on a dual-processor system:
00:00:01          CPU     %user     %nice   %system     %idle
00:10:00            0      4.19      1.75      0.70     93.37
00:10:00            1      8.59      2.18      0.63     88.60
00:20:01            0      1.87      3.21      1.14     93.78
00:20:01            1      1.35      3.12      1.04     94.49
…
23:50:01            0     42.84      0.03      0.80     56.33
23:50:01            1     45.29      0.01      0.74     53.95
Average:            0      6.00      5.01      2.74     86.25
Average:            1      5.61      4.97      2.99     86.43
|
There are a total of seventeen different sections present in reports generated by the default Red Hat Linux sar configuration; many are discussing in upcoming chapters. For more information about the data contained in each section, see the sar(1) man page.